Python Dashboards with Plotly & Dash Training in Abuja Nigeria
Build Interactive Data Dashboards with BSCDC
Kickstart your journey into Python Dashboard Development with Plotly and Dash at BSCDC, Africa’s leading tech and digital skills training center. Learn to turn raw data into interactive dashboards and web-based analytics tools that businesses actually use to make decisions.
There’s a moment when your data stops being numbers on a screen… and starts telling a story people can click, explore, and understand. That’s what this course is really about.
Aligned with BSCDC Africa’s mission to deliver affordable, practical, hands-on tech education, our hybrid online and physical Python Dashboards training equips beginners, analysts, and developers to become job-ready dashboard developers and data visualization specialists across Nigeria, Africa, and globally.
The Best Python Dashboards Training in Nigeria and Africa
Interactive dashboards are in high demand across industries. At Bizmarrow Skills and Career Development Center (BSCDC), you’ll learn how to:
- Build interactive dashboards using Plotly and Dash
- Turn datasets into dynamic visualizations
- Create web-based analytics applications
- Connect dashboards to real-time or static data sources
- Deploy dashboards for business, startups, or clients
Whether you’re searching for:
- Best Python dashboard training in Abuja
- Data visualization courses in Lagos, Kano, Port Harcourt
- Dashboard development training in Kenya, Ghana, South Africa
BSCDC gives you what most courses don’t.
Real projects. Real tools. Real confidence.rtfolio-ready projects, and mentorship from professionals.
Why Learn Plotly and Dash?
Excel dashboards are fine. Power BI is popular.
But Python dashboards… they give you control.
With Plotly and Dash, you can:
- Build fully interactive, web-based dashboards
- Customize every detail of your visualizations
- Integrate analytics directly into applications
- Deliver solutions clients can actually use, not just view
It’s the difference between showing data… and building tools with it.
Why Our Training is Different
Some courses stop at charts.
We go further.
At BSCDC, you’ll learn:
- How to think like a dashboard developer
- How to structure data for real-world applications
- How to build dashboards people can interact with
- How to deploy and share your work professionally
Hands-On, Project-Based Learning
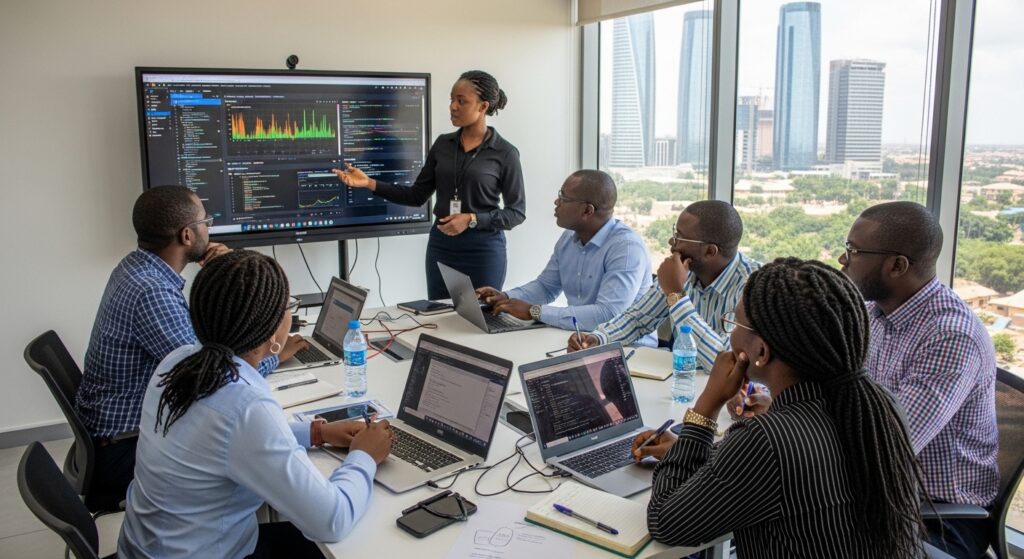
From early on, you’ll start building:
- Interactive charts with Plotly
- Multi-page dashboards using Dash
- Filters, dropdowns, and user controls
- Data-driven applications with real-world use cases
At first, it might feel like a lot. Then suddenly… it starts making sense.
Real Projects Before Graduation
You won’t just “learn” dashboards. You’ll build them.
You’ll graduate with:
- Portfolio-ready Python dashboard projects
- Interactive applications you can show employers or clients
- Real experience solving business data problems
Learn from Industry Professionals
Our trainers bring real-world experience in:
- Data analysis and visualization
- Dashboard development and deployment
- Business intelligence and reporting
So you’re not just learning tools… you’re learning how they’re actually used.
- Flexible Hybrid Learning
- Physical classes in Abuja
- Live online classes for Lagos, Kano, Port Harcourt
- Open to students across Africa and globally
Mentorship and Career Support
We help you go beyond learning:
- Build a strong dashboard portfolio
- Prepare for data and developer roles
- Access freelance and remote opportunities
- Position yourself in a competitive global market
What You Will Learn in Python Dashboards Training
This course is structured to take you from basics to advanced dashboard creation.
Portfolio-ready projects for job and freelance opportunitiesready projects, and mentorship from professionals.
- Python for Data Visualization
- Refresh Python fundamentals
- Working with Pandas for data handling
- Preparing datasets for visualization
- Plotly for Interactive Charts
- Creating line charts, bar charts, scatter plots
- Advanced visualizations and styling
- Building interactive graphs with hover effects and filters
- Dash Framework for Web Apps
- Building web-based dashboards using Dash
- Layout design and structure
- Adding interactivity with callbacks
- Dashboard Features & Functionality
- Dropdowns, filters, and user inputs
- Multi-page dashboards
- Real-time data updates (basic concepts)
- Deployment & Real-World Projects
- Deploying dashboards online
- Building business dashboards (sales, marketing, finance)
Learn Python Dashboards Across Nigeria and Africa
These skills are accessible wherever you are:
- Physical classes in Abuja
- Online classes for Lagos, Kano, Port Harcourt
- Students from Kenya, Ghana, South Africa
- International students from the UK, USA, Canada
Once you can build dashboards, location matters a lot less.
Why Python Dashboard Skills Are in High Demand
Businesses don’t just want data.
They want tools that make sense of it.
With these skills, you can:
- Work as a data analyst or dashboard developer
- Build custom dashboards for companies
- Offer freelance dashboard development services
- Create analytics tools for startups and organizations
Who Should Take This Training
This course is perfect for:
1.Freelancers building analytics solutions
2.Data analysts and aspiring analysts
3.Python developers
4.Business professionals working with data
Why BSCDC is a Leading Data Visualization Training Center in Africa
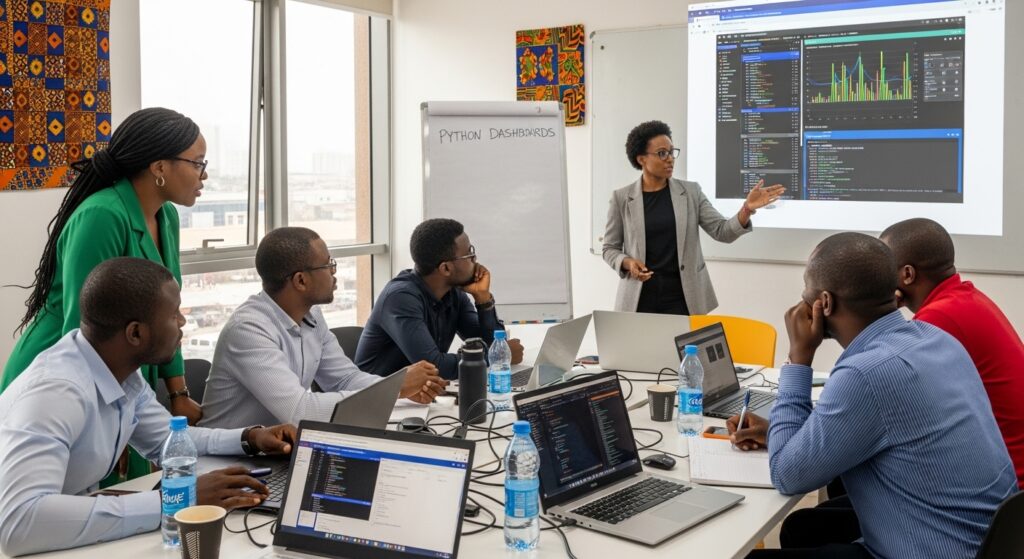
Students choose BSCDC because of one simple thing. It works.
- Over 14 years of experience in tech training
- Hands-on, project-based learning
- Mentorship that actually guides you
- Affordable training with global relevance
We don’t just teach dashboards.
We teach you how to build tools people rely on.
Start Your Python Dashboard Development Career Today
This is where data meets usability.
Learn practical skills to:
- Build interactive dashboards and web apps
- Turn raw data into actionable insights
- Work in analytics, development, or freelance roles
- Create tools businesses actually depend on
Enroll in Python Dashboards with Plotly & Dash Training at BSCDC
Join learners across Nigeria and Africa building real, interactive data dashboards.
Design. Build. Deploy.
Create dashboards that people don’t just look at… but use.
Bizmarrow Skills and Career Development Center (BSCDC)
Abuja, Nigeria | Training Africa’s Next Generation of Data & Dashboard Professionals
Your journey into interactive data visualization starts now.
Frequently Asked Questions (FAQs)
-
Where can I learn Python dashboard development in Abuja?
BSCDC offers practical training using Plotly and Dash with real projects.
-
Can I learn this online in Nigeria or Africa?
Yes. Our live online classes are accessible globally.
-
Do I need prior Python knowledge?
Basic Python helps, but beginners can follow with guided support.
-
How long does it take to learn dashboard development?
You can build functional dashboards within a few months of training.
-
Can I earn income after this training?
Yes. Dashboard development is valuable for freelance, remote, and corporate roles.
-
Is this skill in demand in Africa?
Very much. Businesses need interactive dashboards for decision-making.
-
Can international students enroll?
Yes. Students across Africa and globally can join online.
-
Will I build real dashboards during training?
Yes. You’ll create fully interactive dashboards for your portfolio.